Gold has given very strong returns since early 2024, but experienced investors warn it can also disappoint. Experts say gold usually performs well during global trouble or uncertainty. For example, gold crossed $2,000 per ounce in March 2022 after the Russia-Ukraine war began. Analysts say different events have driven past gold bull markets like oil crisis, stagflation, rebound trade, Plaza Accord, quantitative easing, and COVID.
In January recently, gold prices crossed $5,500 per ounce due to a weaker U.S. dollar and higher demand from investors and central banks, as stated by Kiplinger. Prices later fell slightly but gold still has strong support in markets. Experts now say gold acts more like protection against geopolitical risks than inflation. Despite strong gains in some periods, gold has mostly performed worse than stocks in the long term. From 1971 to 1980, gold rose from $35 to $840 per ounce, giving over 40% yearly growth.
Since 1980, gold’s average yearly return has been around 6% only. Gold is often called an inflation hedge, but data shows it only keeps pace with inflation, not beats it. In short and medium term, gold performs poorly against inflation. Gold ETFs and mining stocks can help traders, but timing entry and exit is important. Long-term buy-and-hold investing in gold has often disappointed investors. In 2022, markets were bad for stocks and bonds, inflation was high, yet gold prices ended the year almost unchanged.
Performance Over 40 Years
Over the past 40 years, U.S. stocks performed best, beating gold and bonds. From 1985–2025, S&P 500 returned 11.9% annually before inflation. After inflation, stocks returned 8.9% annually. Bonds returned 5.2% annually before inflation and 2.3% after inflation. Gold returned 6.7% annually before inflation and 3.8% after inflation.
Performance Over 30 Years
From 1995–2025, stocks again beat gold and bonds. Stocks returned 11.1% annually before inflation and 8.4% after inflation, as stated by Kiplinger. Bonds returned 4% annually and 1.5% after inflation. Gold returned 8.1% annually and 5.4% after inflation. Gold price fell about 27% from 1989 to 1999 during strong economic growth.
Performance over 20 years
From 2005–2025, gold returned 11.6% annually before inflation. After inflation, gold returned 8.8% annually. Stocks returned 10.7% annually or 7.9% after inflation. Bonds performed worst with 3.2% returns or 0.6% after inflation.
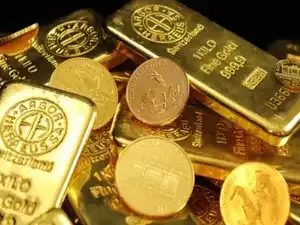
Gold is popular but not always the most expensive precious metal. Rhodium, iridium, palladium, and platinum can cost more than gold.
The largest gold coin was made by the Perth Mint in 2012. The coin is called the Australian Kangaroo One Tonne Gold Coin. It weighs one metric tonne and is about 80 cm wide. Its face value is 1 million Australian dollars. Its gold value today would be about $120 million USD, as noted by Kiplinger.
Not always – gold can rise in crises but usually underperforms stocks over long periods.
Q2: Does gold protect against inflation?
Only partially – gold keeps up with inflation sometimes but does not always beat it.
In January recently, gold prices crossed $5,500 per ounce due to a weaker U.S. dollar and higher demand from investors and central banks, as stated by Kiplinger. Prices later fell slightly but gold still has strong support in markets. Experts now say gold acts more like protection against geopolitical risks than inflation. Despite strong gains in some periods, gold has mostly performed worse than stocks in the long term. From 1971 to 1980, gold rose from $35 to $840 per ounce, giving over 40% yearly growth.
Since 1980, gold’s average yearly return has been around 6% only. Gold is often called an inflation hedge, but data shows it only keeps pace with inflation, not beats it. In short and medium term, gold performs poorly against inflation. Gold ETFs and mining stocks can help traders, but timing entry and exit is important. Long-term buy-and-hold investing in gold has often disappointed investors. In 2022, markets were bad for stocks and bonds, inflation was high, yet gold prices ended the year almost unchanged.
Performance Over 40 Years
Over the past 40 years, U.S. stocks performed best, beating gold and bonds. From 1985–2025, S&P 500 returned 11.9% annually before inflation. After inflation, stocks returned 8.9% annually. Bonds returned 5.2% annually before inflation and 2.3% after inflation. Gold returned 6.7% annually before inflation and 3.8% after inflation.
Performance Over 30 Years
From 1995–2025, stocks again beat gold and bonds. Stocks returned 11.1% annually before inflation and 8.4% after inflation, as stated by Kiplinger. Bonds returned 4% annually and 1.5% after inflation. Gold returned 8.1% annually and 5.4% after inflation. Gold price fell about 27% from 1989 to 1999 during strong economic growth.
Performance over 20 years
From 2005–2025, gold returned 11.6% annually before inflation. After inflation, gold returned 8.8% annually. Stocks returned 10.7% annually or 7.9% after inflation. Bonds performed worst with 3.2% returns or 0.6% after inflation.
Gold and Inflation
Gold prices usually do not track inflation closely. Between 1987–2001, inflation averaged around 3% but gold prices fell. Gold surged during very high inflation in late 1970s. Gold crossed $800 then fell to $400 by 1981, as cited by Kiplinger. In 2022 inflation was high, but gold stayed mostly flat. Gold rose 13% early in 2022 but later dropped 10%. By end of 2022, gold prices were almost unchanged. Treasury Inflation-Protected Securities (TIPS) are better inflation hedges.Gold during crisis
Gold usually rises when investors are fearful. During COVID-19 crash in 2020, stocks fell over 30% while gold stayed stable. Gold then rose 36% by August 2020 to about $2,067 per ounce. Gold also performed well after 9/11 and the 2008 financial crisis. Trade fears and rising deficits pushed gold above $5,500 in early 2026. Gold also gained 65% during the 2025 rally. Gold usually rises with bad news and falls with good economic news.Gold not a stable store of value
Gold prices are very volatile and not stable over time. Gold rose 6% in 2012 but fell 28% in 2013. Gold gained 12.6% in 2017 and fell 1.2% in 2018. Gold dropped 16.5% in five years ending 2016. Gold then rose about 50% in recent years, as per the report by Kiplinger.Gold is popular but not always the most expensive precious metal. Rhodium, iridium, palladium, and platinum can cost more than gold.
Gold funds vs physical gold
Funds are easier than buying physical gold coins or bars. Investors avoid storage and insurance issues with funds. Gold bars in New York Fed vault weigh about 27 pounds each. SPDR Gold Shares ETF has about $105 billion in assets, as noted by Kiplinger. iShares Gold Trust has lower fees than SPDR Gold Shares. Investors can also buy gold mining company funds.Gold vs Silver
Silver is more volatile than gold. Silver prices rose nearly 150% in 2025. In February 2026, silver lost about half its value in one week. Experts say gold is safer than silver for stability.The largest gold coin was made by the Perth Mint in 2012. The coin is called the Australian Kangaroo One Tonne Gold Coin. It weighs one metric tonne and is about 80 cm wide. Its face value is 1 million Australian dollars. Its gold value today would be about $120 million USD, as noted by Kiplinger.
FAQs
Q1: Is gold a safe long-term investment?Not always – gold can rise in crises but usually underperforms stocks over long periods.
Q2: Does gold protect against inflation?
Only partially – gold keeps up with inflation sometimes but does not always beat it.